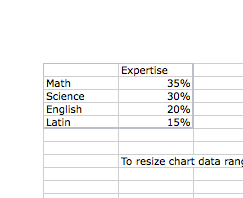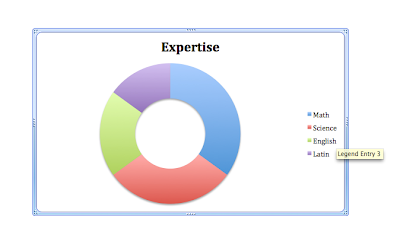
 Charts are versatile in organizing lists of information. Charts compliment tables of information, so the person viewing the document will understand much more.
 I could have represented a better chart by adding more subject fields in my table and chart.
No comments:
Post a Comment